* Split interfaces

* add filters

* feat: split interfaces and add filters (without locales)

* make it an line chart

* fix the colors

* remove tx rx tooltip

* fill the chart

* update chart and cleanup

* chore

* update system tab

* Fix alerts

* chore

* fix chart

* resolve conflicts

* Use new formatSpeed

* fix records

* update pakage

* Fix network I/O stats compilation errors

- Added globalNetIoStats field to Agent struct to track total bandwidth usage
- Updated initializeNetIoStats() to initialize both per-interface and global network stats
- Modified system.go to use globalNetIoStats for bandwidth calculations
- Maintained per-interface tracking in netIoStats map for interface-specific data

This resolves the compilation errors where netIoStats was accessed as a single struct
instead of a map[string]NetIoStats.

🤖 Generated with [Claude Code](https://claude.ai/code)

Co-Authored-By: Claude <noreply@anthropic.com>

* Remove redundant bandwidth chart and fix network interface data access

- Removed the old Bandwidth chart since network interface charts provide more detailed per-interface data
- Fixed system.tsx to look for network interface data in stats.ni instead of stats.ns
- Fixed NetworkInterfaceChart component to use correct data paths (stats.ni)
- Network interface charts should now display properly with per-interface network statistics

🤖 Generated with [Claude Code](https://claude.ai/code)

Co-Authored-By: Claude <noreply@anthropic.com>

* Restore split network metrics display in systems table

- Modified systems table Net column to show separate sent/received values
- Added green ↑ arrow for sent traffic and blue ↓ arrow for received traffic
- Uses info.ns (NetworkSent) and info.nr (NetworkRecv) from agent
- Maintains sorting functionality based on total network traffic
- Shows values in appropriate units (B/s, KB/s, MB/s, etc.)

This restores the split network metrics view that was present in the original
feat/split-interfaces branch before the merge conflict resolution.

🤖 Generated with [Claude Code](https://claude.ai/code)

Co-Authored-By: Claude <noreply@anthropic.com>

* Remove unused bandwidth fields and calculations from agent

Removed legacy bandwidth collection code that is no longer used by the frontend:

**Removed from structs:**
- Stats.Bandwidth [2]uint64 (bandwidth bytes array)
- Stats.MaxBandwidth [2]uint64 (max bandwidth bytes array)
- Info.Bandwidth float64 (total bandwidth MB/s)
- Info.BandwidthBytes uint64 (total bandwidth bytes/s)

**Removed from agent:**
- globalNetIoStats tracking and calculations
- bandwidth byte-per-second calculations
- bandwidth array assignments in systemStats
- bandwidth field assignments in systemInfo

**Removed from records:**
- Bandwidth array accumulation and averaging in AverageSystemStats
- MaxBandwidth tracking in peak value calculations

The frontend now uses only:
- info.ns/info.nr (split metrics in systems table)
- stats.ni (per-interface charts)

This cleanup removes ~50 lines of unused code and eliminates redundant calculations.

🤖 Generated with [Claude Code](https://claude.ai/code)

Co-Authored-By: Claude <noreply@anthropic.com>

* Optimize network collection for better performance

**Performance Improvements:**
- Pre-allocate NetworkInterfaces map with known capacity to reduce allocations
- Remove redundant byte counters (totalBytesSent, totalBytesRecv) that were unused
- Direct calculation to MB/s, avoiding intermediate bytes-per-second variables
- Reuse existing NetIoStats structs when possible to reduce GC pressure
- Streamlined single-pass processing through network interfaces

**Optimizations:**
- Reduced memory allocations per collection cycle
- Fewer arithmetic operations (eliminated double conversion)
- Better cache locality with simplified data flow
- Reduced time complexity from O(n²) operations to O(n)

**Maintained Functionality:**
- Same per-interface statistics collection
- Same total network sent/recv calculations
- Same error handling and reset logic
- Same data structures and output format

Expected improvement: ~15-25% reduction in network collection CPU time and memory allocations.

🤖 Generated with [Claude Code](https://claude.ai/code)

Co-Authored-By: Claude <noreply@anthropic.com>

* Fix the Unit preferences

* Add total bytes sent and received to network interface stats and implement total bandwidth chart

* chore: fix Cumulative records

* Add connection counts

* Add connection stats

* Fix ordering

* remove test builds

* improve entre command in makefile

* rebase
Beszel
Beszel is a lightweight server monitoring platform that includes Docker statistics, historical data, and alert functions.
It has a friendly web interface, simple configuration, and is ready to use out of the box. It supports automatic backup, multi-user, OAuth authentication, and API access.


Features
- Lightweight: Smaller and less resource-intensive than leading solutions.
- Simple: Easy setup with little manual configuration required.
- Docker stats: Tracks CPU, memory, and network usage history for each container.
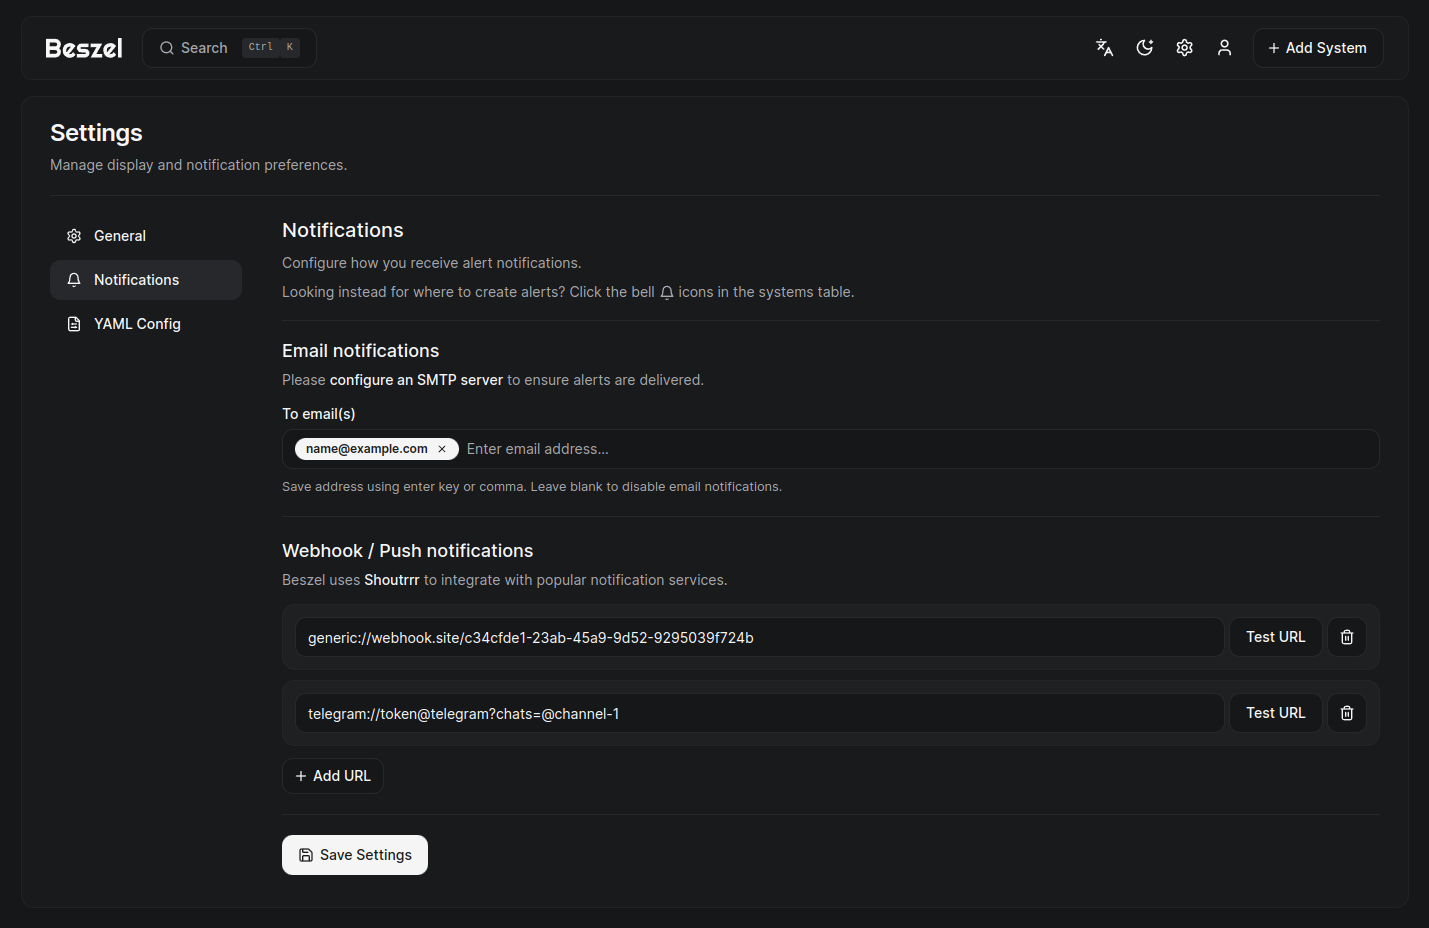
- Alerts: Configurable alerts for CPU, memory, disk, bandwidth, temperature, load average, and status.
- Multi-user: Users manage their own systems. Admins can share systems across users.
- OAuth / OIDC: Supports many OAuth2 providers. Password auth can be disabled.
- Automatic backups: Save to and restore from disk or S3-compatible storage.
Architecture
Beszel consists of two main components: the hub and the agent.
- Hub: A web application built on PocketBase that provides a dashboard for viewing and managing connected systems.
- Agent: Runs on each system you want to monitor and communicates system metrics to the hub.
Getting started
The quick start guide and other documentation is available on our website, beszel.dev. You'll be up and running in a few minutes.
Screenshots
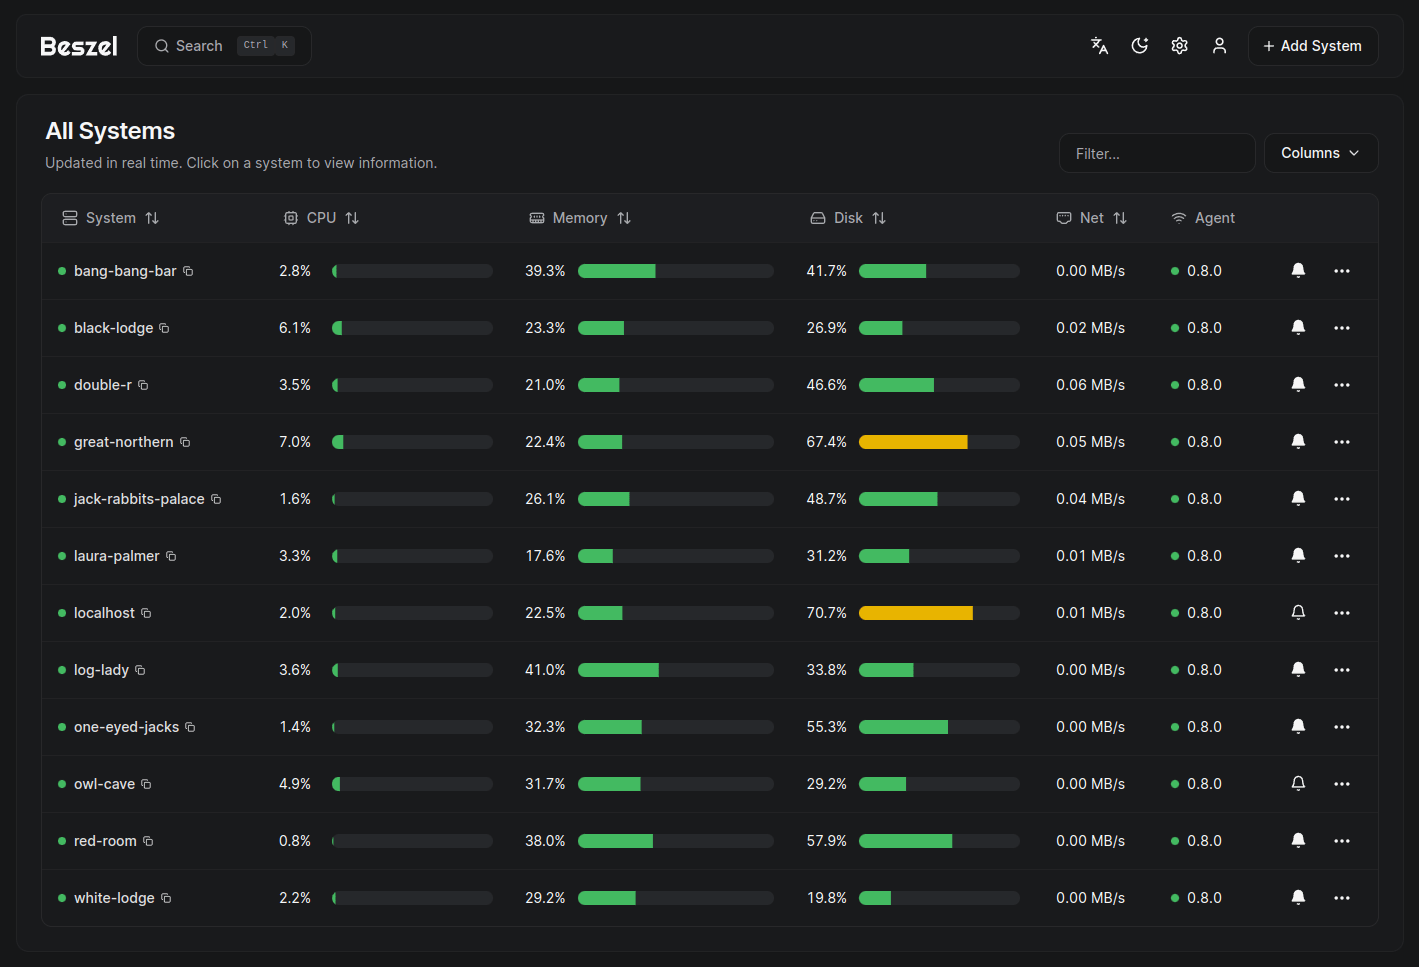
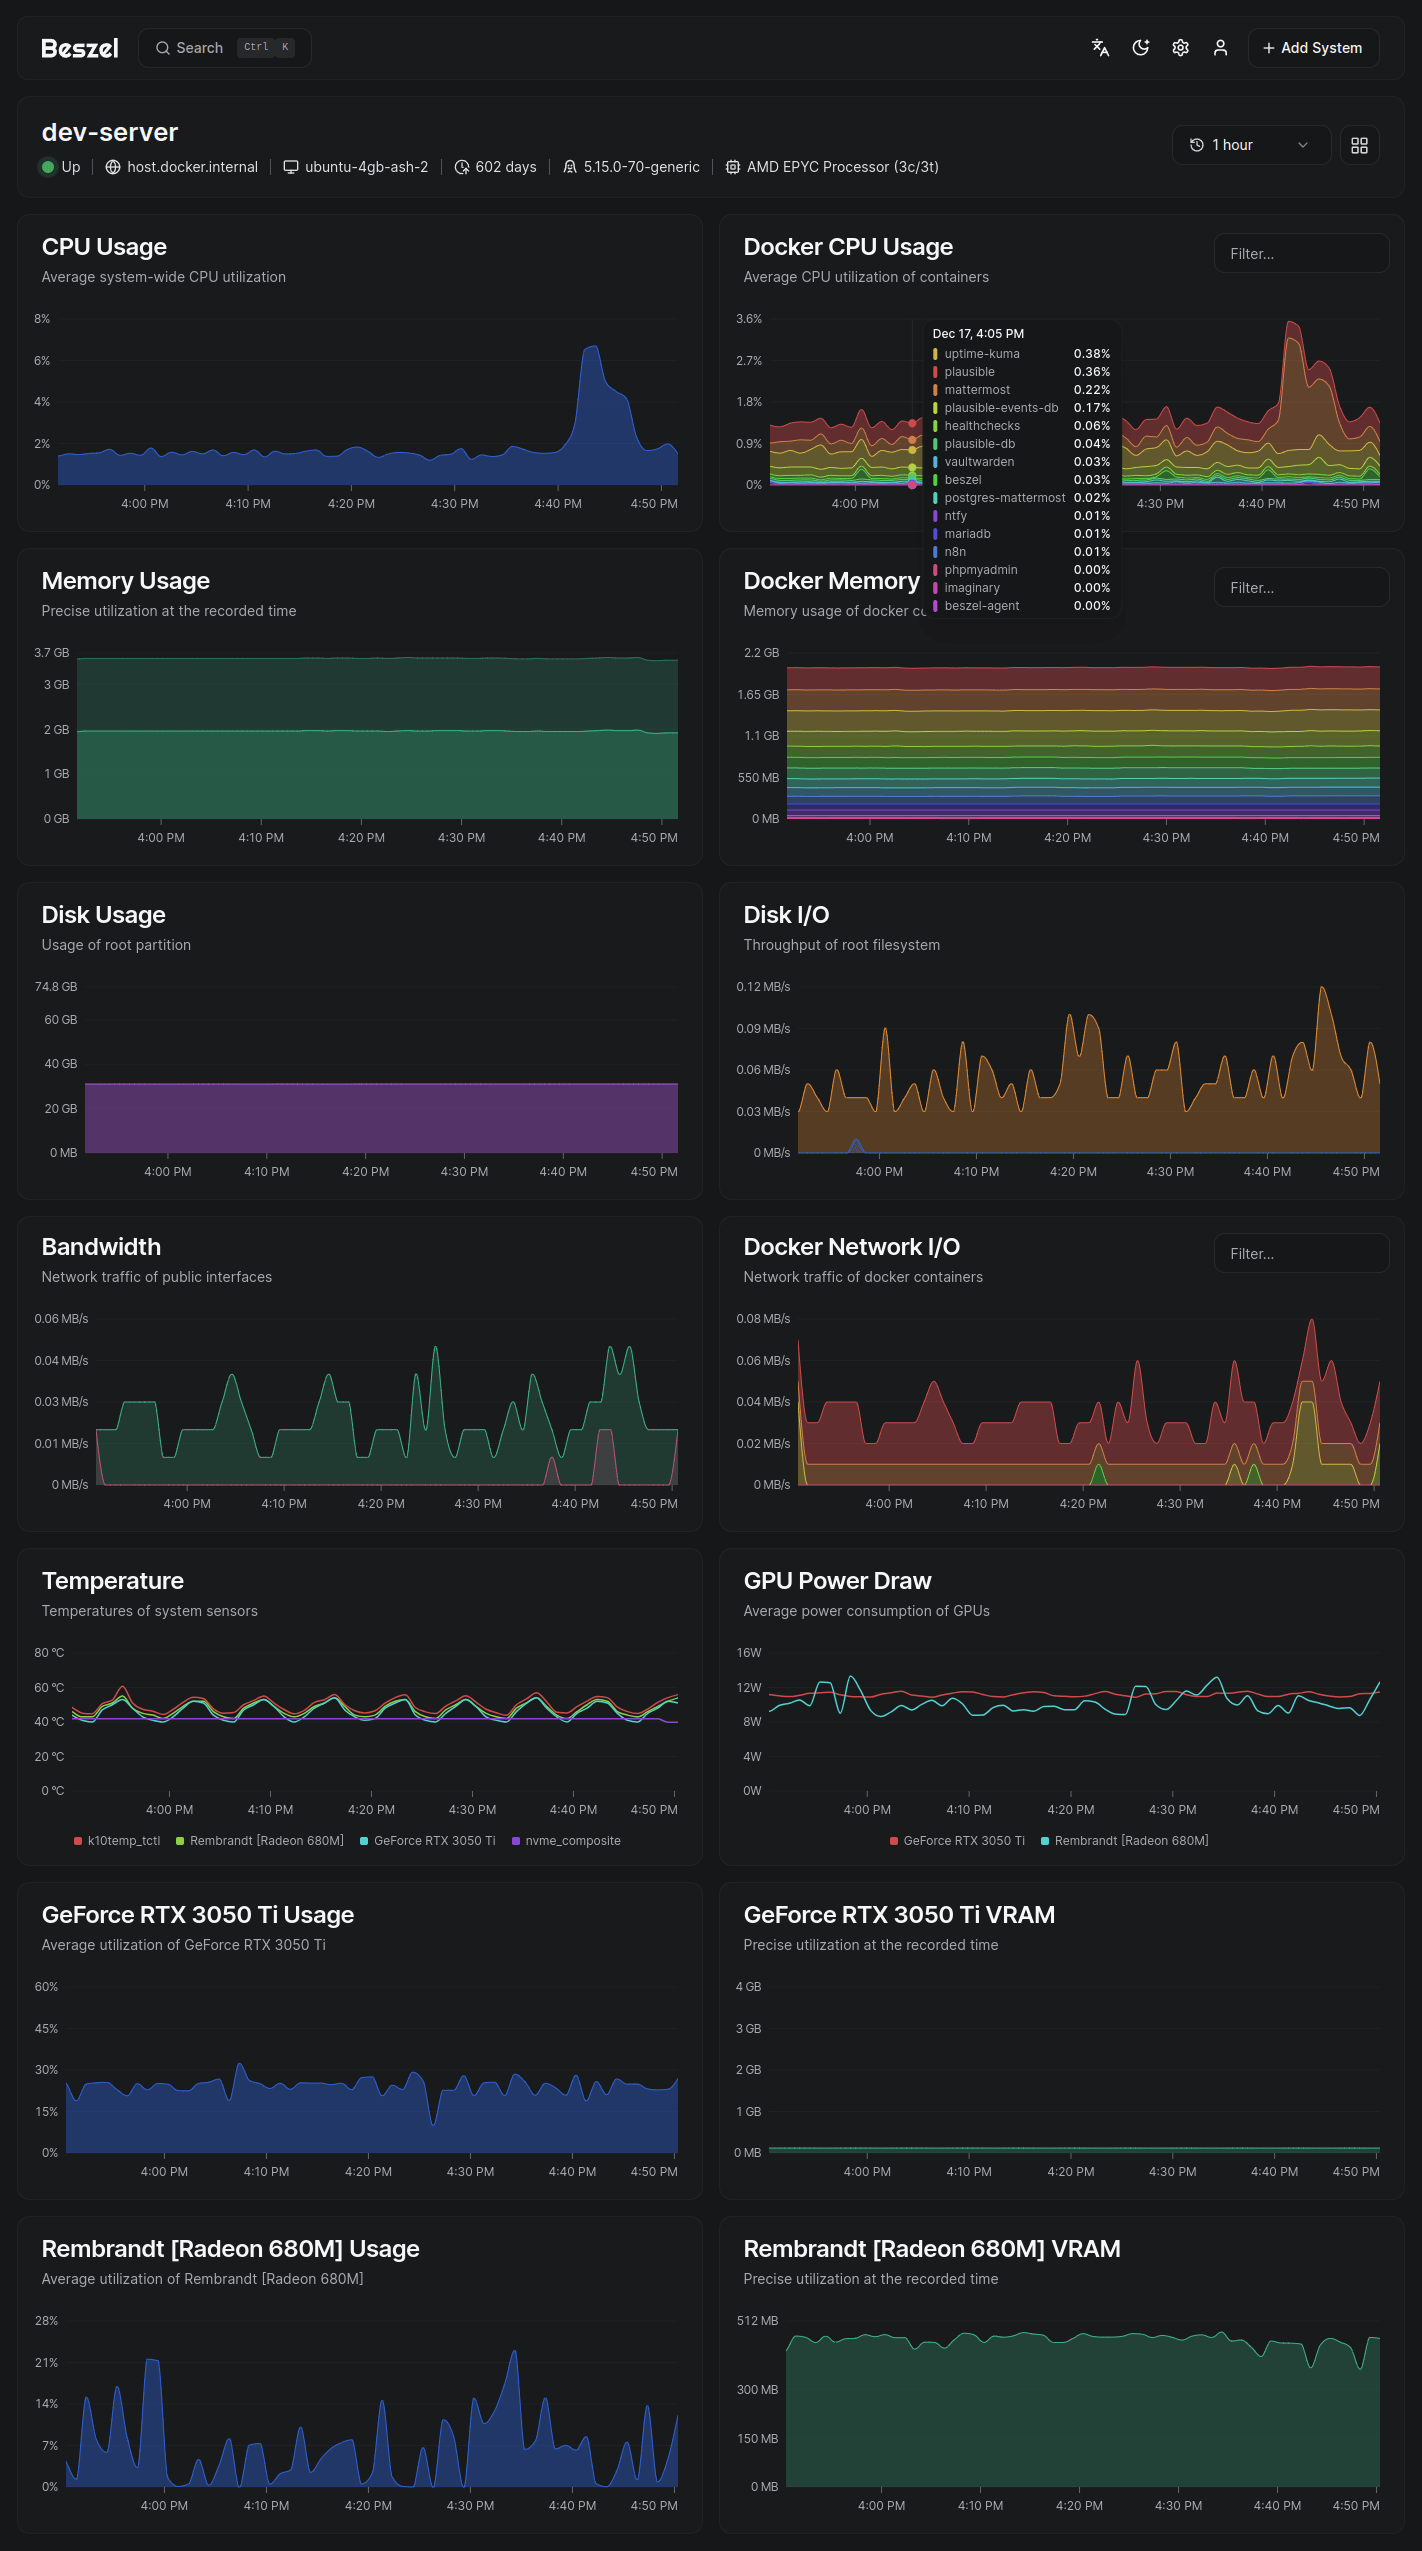
Supported metrics
- CPU usage - Host system and Docker / Podman containers.
- Memory usage - Host system and containers. Includes swap and ZFS ARC.
- Disk usage - Host system. Supports multiple partitions and devices.
- Disk I/O - Host system. Supports multiple partitions and devices.
- Network usage - Host system and containers.
- Load average - Host system.
- Temperature - Host system sensors.
- GPU usage / temperature / power draw - Nvidia and AMD only. Must use binary agent.
- Battery - Host system battery charge.
Help and discussion
Please search existing issues and discussions before opening a new one. I try my best to respond, but may not always have time to do so.
Bug reports and feature requests
Bug reports and detailed feature requests should be posted on GitHub issues.
Support and general discussion
Support requests and general discussion can be posted on GitHub discussions or the community-run Matrix room: #beszel:matrix.org.
License
Beszel is licensed under the MIT License. See the LICENSE file for more details.